As we mentioned in our previous post, an e-commerce's budget allocation is one of the most important tasks. In this post, we explain how we do it for you
As you know, the balance between an e-commerce's metrics is very delicate. Not only are there lots of measurable things, but each one affects and is affected by many others. Determining the budget for marketing, and deciding the division between channels is no easy task, and requires an understanding of these relations.
However, as there are so many variables, and some relations so delicate it's even hard to notice them when analyzing data, we've decided to build a tool that puts together experts' knowledge along with Machine Learning algorithms, to give you the best budget allocation model you can get.
The model
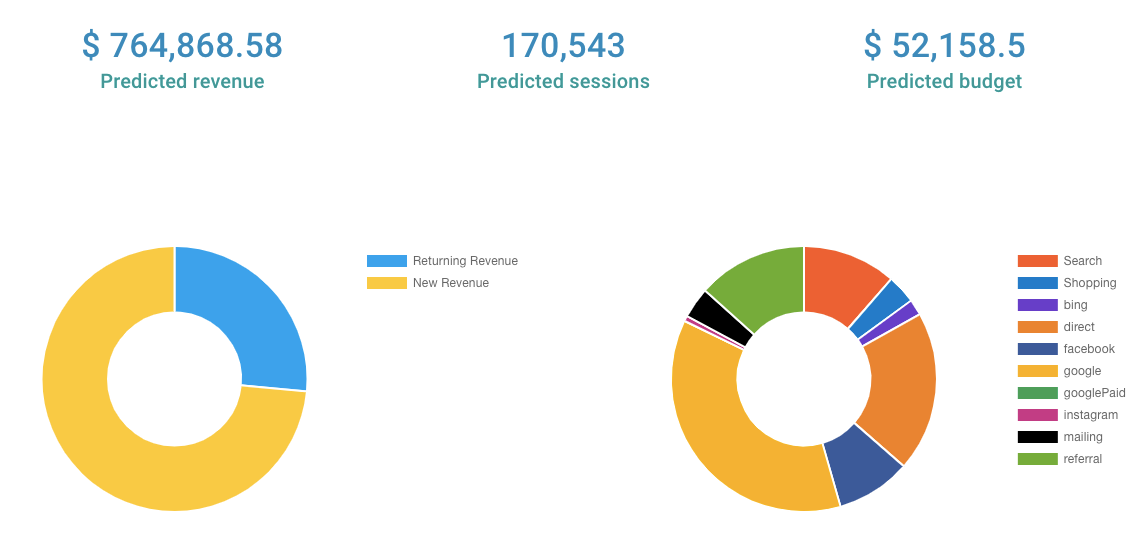
Because of all the involved metrics, and the importance of your budget allocation, we provide you with a wide range of information from this model: of course, the budget you need and its distribution per source, but also the number of sessions you need from every source, including organic sources; the size your audiences should be for you to be able to bring those sessions; the revenue we expect you to make; and how much of that revenue is going to come from returning customers, and how much from new ones.
We follow a number of steps to estimate all of this, but it all starts with the revenue you're gonna make.
a. Revenue
The first step for us is to predict how much money you will make, following the tendency you have had so far.
In this first part, what we do is an accurate prediction of how much revenue you are going to make over the next 30 days. This prediction considers not only the seasonalities your store has, but also the special dates (like Black Friday), and lets out outliers (like really specific campaigns you had for one or a couple of days that shifted considerably your revenue of the period, or B2B sales).
Now, our model is quite special, because not only do we let you see how much money you're supposed to make, but we also let you plat with your numbers a little. After we give you the estimated revenue, you can choose if you wan to 'keep' that prediction, or if you actually want to make a little bit more or a little bit less money. You can adjust revenue by adding up to 30%, or by reducing it up to 30%. So if we predicted you'll make $1,000, you can see the predictions for a revenue as low as $700, $800, $900, etc, all the way up to $1,300.
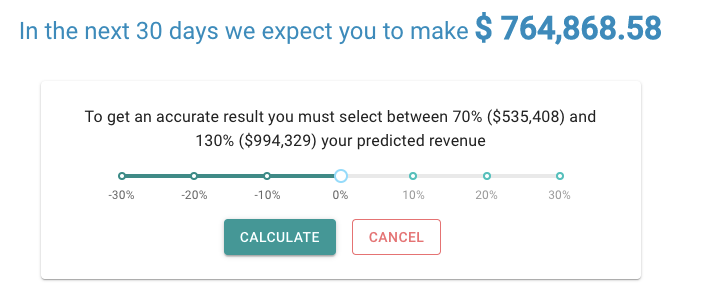
We do want to stress out, however, that the predictions are more accurate for the baseline value (the $1,000 in the example). This is because of the natural growth trend your store has, and forcing the increase or decrease in revenue is affected by the lag you have in advertising (the amount of time it takes users to buy since they see your ads). We do the prediction from today forward, and you want to affect sales from today forward... But those sales are also affected by what you did in the last few days (or weeks). Even though we do capture a bit of this behavior looking at your customer journeys, the number of sessions you had in the last period, and estimate the number of people we can expect to come back, this behavior is not 100% captured by this (maybe your refraction period is longer, maybe you had a massive campaign that is still producing results, etc). These simulations are really good, but the best one is the one for the baseline revenue.
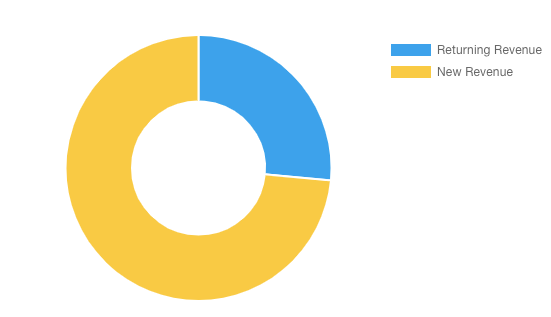
Now, we don't estimate only your total revenue, but we actually divide that revenue in two:
1) Returning revenue. This is the revenue that existing customers will bring to your store. Depending on your store, CLV and repurchase rate, this revenue may be very large or very small compared to the total revenue. This is the 'easy money', because customers know you and understand the value of your products, and can be obtained not only by repurchases, but also
2) New revenue. This, on the other hand, is revenue that will be generated solely by new customers. This is harder money to make, but comes with the reward of growing your customer database, allowing you to scale... And make much more money.
Ok, moving on. Once this is done, we pass to next part: the total number of sessions needed to achieve that revenue
b. Sessions
This part is comprised of 2 components. For both we use the help of the paths users follow before completing a transaction in your site (to know more about this, read our article on customer journeys )
a) First, the number of returning sessions you are naturally going to have because of the efforts you did in the last 30 days. It's important to mark that not all of these people are ready to buy yet, and that their coming back to your page may need the influence of other ads, or simply multiple subsequent visits. There are two key aspects to determine how many sessions will be produced, and from where: first, the Bounce Rate of your page. We assume all the bounces are not coming back. We also remove all the sessions which led to a purchase in that period. It's only the sessions that are left after this that we take into account for return. Only then do we refer to your customer journeys: we see the last contact point you had with every user, to know where they are standing, and see the optimal path to conversion from there. This way, we allocate the returning sessions.
b) The number of new sessions you have to bring. In addition to bringing back the old people, you also need to bring new people to your page. Here we turn to customer journeys once again. This time, we see the optimal conversion paths since the very first contact with a customer until conversion, and estimate the new sessions you would have to bring per source. Now, because of the cross-device problem, this optimal paths may not include all traffic sources that are important to you. Your traffic may come mainly from Facebook, but Facebook's influence in purchases may well be lost in the cross device mess. So this approach would say not to spend on Facebook, even if it's a key source for you... How would we notice? And how do we fix it? Because of the growth we are allowing channels with this optimal-path distribution. We look at the traffic sources we are including for these new sessions, and see how much of the total sessions they represent. Then, we look at your historical data. If this new distribution (possible cross-device biased) is resulting in changes too large between channels, we set a cap on the sessions each source can have, and add the neglected channels to fill in the gap. You should know that a) This will only happen if your store has a massive cross-device derived information bias, and b) this 'fill in the gap' distribution is also estimated from your historical data.
c. CPS
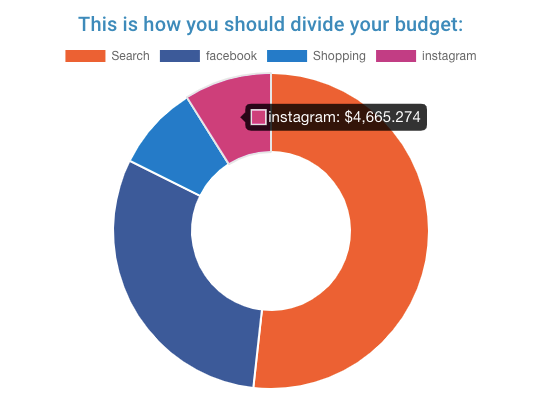
Once we have found the number of sessions you have to bring, we can move on to the budget definition. Having the number of sessions per source, it's easy to calculate that source's budget: we just have to look at the CPS of every source.
Now, how do we do it? A source's CPS varies a lot both over time, and depending on the audiences your use. So, CPS is also estimated. We do a general CPS prediction for each one of the sources, using the information of how the CPS changes both over time, and depending on the number of sessions.
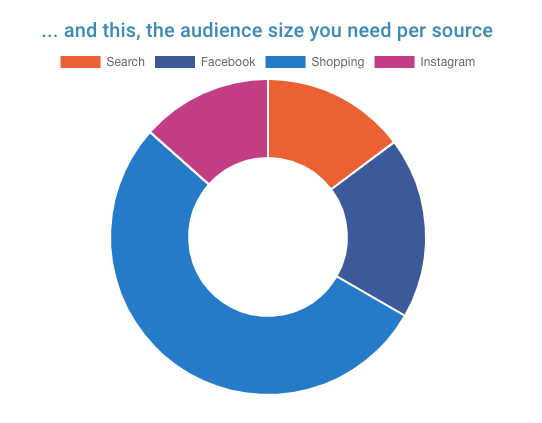
d. Reach
As a final step, we estimate how many people would have to see your ads in order to bring you the number of sessions we said. This is for you to have a general idea on how plausible your goal is: you con know the size of audiences on Facebook, for example, as well as the average number of searches for a word, so you can have an idea as to if it's an attainable number, or if it's way too high (because of the extra revenue you can run the simulation for). Please note, though, that even if we do take frequency into account, there is no way for us to know the 'mixed frequency' of your ads across channels: all we can do is know the reach for each channel, and divide it bye each channel's frequency. However, it's most probable that a user impacted on one source is also impacted by another source. We can only know the intersection for users who do click on your ads, and only when there is no cross device loss. So the intersection between reaches is much larger, and we have no way of knowing its actual value. This is why, we only take the reach of each source, and then sum it together. We do want to stress out that this sum is an overestimated number, and the one you should pay more attention to is the reach per source, not the total reach, because of the intersections between sources
So in summary, we are giving you an accurate insight not only on how much money you should spend in each source, but also how many sessions you need from each one of your sources, including organic traffic, and how big the audience you target should be (this is the paid sources' reach).
If you want to know more or have any questions or concerns, please drop us an email at hello@sensaimetrics.io